
どうも、三丁目の可視化野郎ことかっぱ (@inokara)です。ちょっと急ぎでインスタンスのリソース可視化環境を作る必要になりましたとさ…。
はじめに
CloudWatch を補助する意味合いもあり dstat での結果を fluentd と growthforecast を利用して可視化したいと思います。本記事作成にあたり以下を参考にさせて頂きました。
登場人物
- dstat
- fluentd(td-agent)
- Growthforecast
それぞれの登場人物についての説明は割愛させて頂きます。Amazon Linux の場合には dstat はインストールが必要ですのでご注意下さい。
sudo yum install dstat
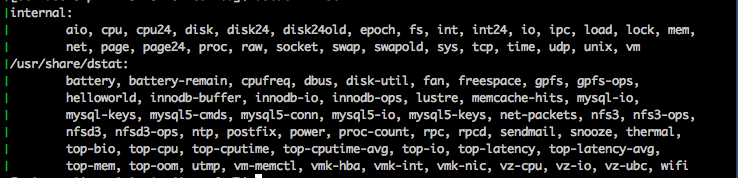
dstat についてはプラグインで監視する項目の追加が可能なようです。
dstat --list
を実行すると以下のようなプラグイン一覧が確認できます。
やったこと
環境
以下のような感じ。
[ [dstat] => [td-agent] => [type out_forward] ] => [ [type in_forward] => [type growthforecast] => [Growthforecast] ]
ちょい解りづらいですね。あとで Cacoo で書き直します。
Growthforecast 側の fluentd の設定
fluent-plugin-growthforecast をインストールしておきます。
sudo /usr/lib64/fluent/ruby/bin/gem install fluent-plugin-growthforecast --no-ri --no-rdoc -V
既に Growthforecast がローカルホストで動いているという前提で fluentd の設定は以下のように設定しました。
td-agent.conf
<source>
  type forward
  port 24224
  bind 0.0.0.0
</source>

<match dstat.*.*="">
  type growthforecast
  gfapi_url http://127.0.0.1:5125/api/
  service dstat
  tag_for section
  name_key_pattern .*
</match>
dstat を動かす側の fluentd の設定
fluent-plugin-map と fluent-plugin-dstat をインストールします。
sudo /usr/lib64/fluent/ruby/bin/gem install fluent-plugin-map fluent-plugin-dstat --no-ri --no-rdoc -V
dstat はインストール済みで CPU と Memory と TCP 接続(netstat)を監視します。
td-agent.conf
<source>
  type dstat
  tag dstat
  option -lcm --tcp
  delay 3
</source>

<match dstat="">
  type forest
  subtype copy
  <template>
    <store>
      type map
      tag "dstat.${hostname}.cpu"
      time time
      record record['dstat']['total cpu usage']
    </store>

    <store>
      type map
      tag "dstat.${hostname}.mem"
      time time
      record record['dstat']['memory usage']
    </store>

     <store>
       type map
       tag "dstat.${hostname}.tcp-sockets"
       time time
       record record["dstat"]["tcp sockets"]
     </store>
  </template>
</match>

<match dstat.**="">
  type forward
  buffer_type file
  buffer_path /tmp/fluent.dstat.buffer
  buffer_chunk_limit 3k
  buffer_queue_limit 3
  retry_wait 30s
  retry_limit 5
  flush_at_shutdown true
  <server>
    host xxx.xxx.xxx.xxx
    port 24224
  </server>
</match>
ちょっと工夫した点とすれば type forest を利用して ${hostname} プレースホルダでタグにホスト名を付けたことくらいでしょうか..。あと、fluent-plugin-dstat はオプションで -lcp –tcp を指定することで以下の項目を監視することになります。
- LoadAverage
- CPU
- Memory
- TCP Sockets
以下のような感じで…
CPU

Memory

TCP Sockets

とりあえずは…
- これでなんとか凌げそうです
- fluentd や各種プラグインや Growthforecast には足を向けて寝れません…
- あと、dstat についてはちゃんと勉強する必要がありそうです
元記事はこちらです。
「dstat の結果を fluentd を利用して growthforecast に飛ばすチートシート」