
New Relicのエージェントプラグインである「on-host integrations」をインストールして、様々なミドルウェアやポート監視ができるので実際の手順を書きます。
エージェントをインストールしただけでは得られないメトリクスや監視を補完することができます。
インストールした環境
- EC2
- Amazon Linux2
インストールしてみたon-host integrations
- MySQL monitoring integration
- Port monitoring integration
手順
基本的な手順
on-host integrationのインストールはとても簡単です。
NewRelicから公式に配布されているyumリポジトリを追加して、yum installを実行するだけです。
あとは各インテグレーション固有の追加設定をしてエージェントの再起動をするだけです。
一部のインテグレーションはyumでインストールできないものもあります。
1.リポジトリの追加
sudo yum -q makecache -y --disablerepo='*' --enablerepo='newrelic-infra'
2.yumでインストールを実行。
<INTEGRATION_FILE_NAME>はインストールするインテグレーションのファイル名です。
ファイル名は公式サイト各インテグレーションのページに記載があります。
例:MySQLならnri-mysql
sudo yum install <INTEGRATION_FILE_NAME>
MySQL monitoring integration
できること
MySQL インテグレーションでは、ご利用のMySQLデータベースからインベントリとメトリックスを収集して当社のプラットフォームに送信します。このプラットフォームで、ご利用のデータベースサーバの健全性を確認し、メトリックデータを分析して、問題の原因を簡単に見つけることができます。
と公式サイトに記載があります。
NewRelicエージェントをインストールしただけでは得られないMySQLの詳細なメトリクスが取得できるようになります。
インストール
1.前述の共通手順でファイル名「nri-mysql」を使用して、インテグレーションをインストール
2.コマンドラインから対象のMySQLへレプリケーション権限がついた監視用ユーザーを作成します。
パスワードやホストなどは合わせて書き換えてください。
sudo mysql -e "CREATE USER 'newrelic'@'%' IDENTIFIED BY 'YOUR_SELECTED_PASSWORD';"
sudo mysql -e "GRANT REPLICATION CLIENT ON *.* TO 'newrelic'@'%' WITH MAX_USER_CONNECTIONS 5;"
3.NewRelicエージェントのインテグレーションフォルダへ移動します。
cd /etc/newrelic-infra/integrations.d
4.設定ファイルをコピーして配置します。
sudo cp mysql-config.yml.sample mysql-config.yml
5.設定ファイル mysql-config.ymlを編集します。
今回設定した内容は以下の通りですが、環境に合わせて設定します。
integration_name: com.newrelic.mysql

instances:
  - name: mysql-server_<ホスト名>
    command: status
    arguments:
        hostname: localhost ※もしくはRDSのエンドポイントなど
        port: 3306
        username: newrelic
        password: ****** ※作成したDBユーザーのパスワード
        # New users should leave this property as `true`, to identify the
        # monitored entities as `remote`. Setting this property to `false` (the
        # default value) is deprecated and will be removed soon, disallowing
        # entities that are identified as `local`.
        # Please check the documentation to get more information about local
        # versus remote entities:
        # https://github.com/newrelic/infra-integrations-sdk/blob/master/docs/entity-definition.md
        remote_monitoring: true
        extended_metrics: true
        extended_innodb_metrics: true
    labels:
        env: production
        role: write
6.エージェントを再起動します。
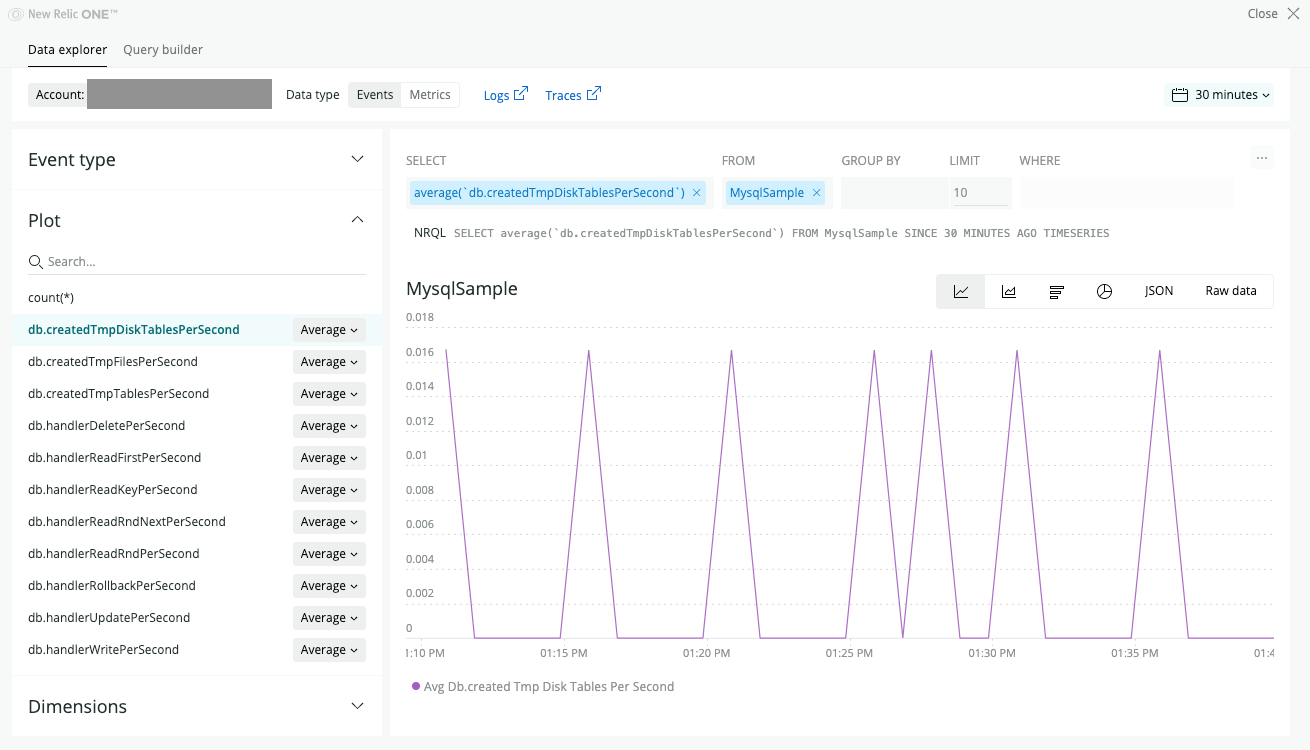
結果
正しくインストールできると、Data explorerなどでMysqlSampleというイベントタイプからMySQLに関する様々なメトリクスが取得可能となります。
Port monitoring integration
できること
Our Port monitoring integration monitors status for networking ports, such as TCP, UDP, etc., and reports data to New Relic.
と公式サイトに記載があります。
設定したネットワークポート(TCP/UDP)へ到達できるかどうかがメトリクス化されて取得可能です。
インストール
1.NewRelic公式のGitHubリポジトリより nri-port-monitor.tar.gzをダウンロードして、展開します。
$ wget https://github.com/newrelic/nri-port-monitor/releases/download/1.3/nri-port-monitor.tar.gz
$ tar -zxvf nri-port-monitor.tar.gz
2.binフォルダに含まれているport-monitorとport-monitor-definition.ymlを/var/db/newrelic-infra/newrelic-integrationsへコピーします。
$ sudo cp ~/nri-port-monitor/bin/port-monitor /var/db/newrelic-infra/newrelic-integrations/bin/
$ sudo cp ~/nri-port-monitor/port-monitor-definition.yml /var/db/newrelic-infra/newrelic-integrations/bin/
3.コピーしたport-monitorへ実行権限を付与します。
エージェントインストール時に対象フォルダへ再帰的に実行権限が付与されているはずなので、通常はファイルコピー時に権限は付いているはずです。
4.設定ファイルをコピーして配置します。
$ sudo cp ~/nri-port-monitor/port-monitor-config.yml.sample /etc/newrelic-infra/integrations.d/port-monitor-config.yml
5.設定ファイル port-monitor-config.ymlを編集します。
今回設定した内容は以下の通りですが、環境に合わせて設定します。
integration_name: com.newrelic.tcp-port-monitor

instances:
  - name: aurora_<ホスト名>
    command: metrics
    arguments:
      address: <監視するネットワークアドレスやエンドポイントなど>
      network: tcp
      timeout: 5
    labels:
      env: production
6.エージェントを再起動します。
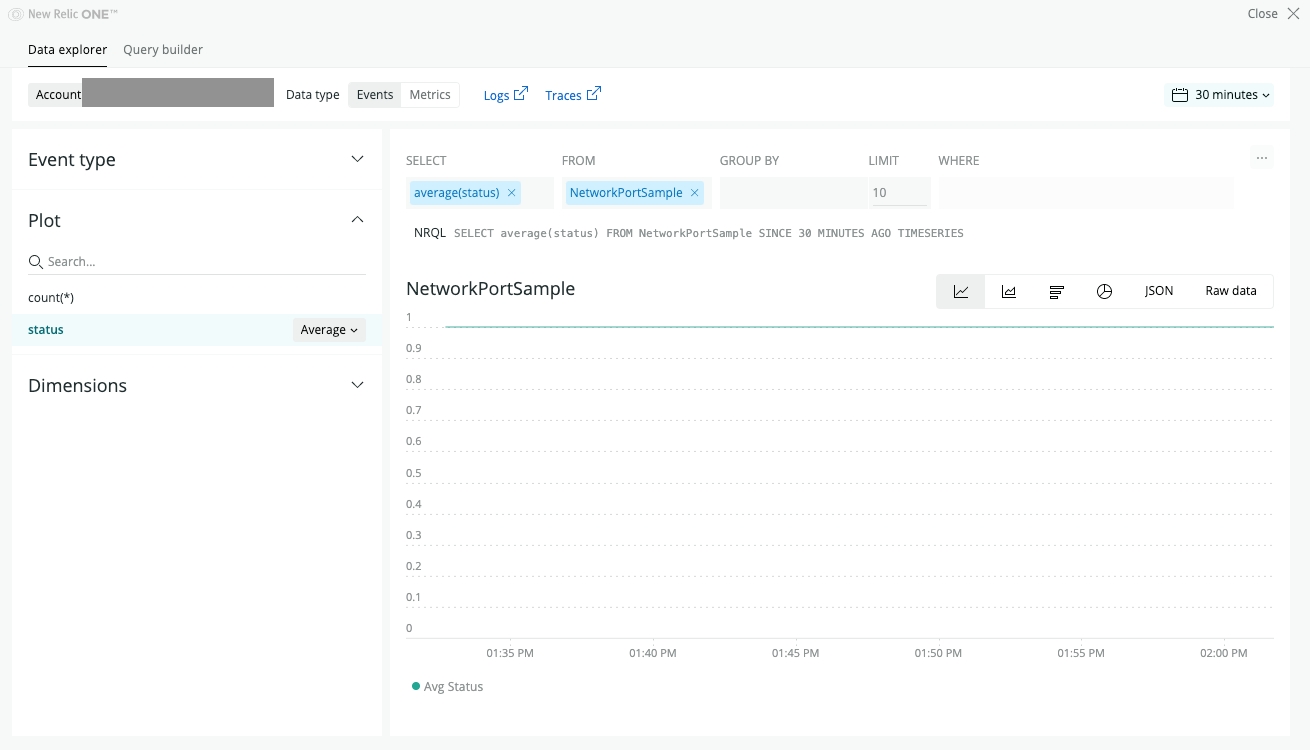
結果
正しくインストールできると、Data explorerなどでNetworkPortSampleというイベントタイプからstatusで1が正常、0が接続不可のメトリクスが取得できます。
参考URL
https://docs.newrelic.co.jp/docs/integrations/host-integrations
https://github.com/newrelic/nri-port-monitor