tl;dr
Datadog で HTTP や TCP のコネクションチェックを行うことが出来るけど、Agent Check が HTTP エンドポイントや TCP ポートへの接続を試行する間隔を指定出来ないのかなって調べたら、以下のように言及されていたので実際に調べてみた。
上記の記事を抜粋。
For example, if you need to run an http check every 60 seconds rather than the default 15 seconds, add the following to the http_check.yaml config file:
min_collection_interval: 60
You can add this parameter at the init_config level or at the instance level.
- http_check はデフォルトは 15 秒ごとにチェックされる
- 変更したい場合には http_check.yaml に
min_collection_intervalで変更可能 init_config又はinstanceに定義することが出来る
ということで動作確認
TCP Server を起動する
こちらの記事で作った Echo サーバーを起動する。
$ python test.py &
[1] 7179
$ ruby test.rb &
[2] 7184
$ echo "test" | nc 127.0.0.1 18181
test
$ echo "test" | nc 127.0.0.1 18282
test
$ tail log.txt
2015-11-17 00:29:11,414 INFO Python TCP Server Test Input:test
I, [2015-11-17T00:29:14.550477 #7184]  INFO -- : Ruby TCP Server Test Input: test
tcp_check を定義する
tcp_check の定義は /etc/dd-agent/conf.d/tcp_check.yaml に施す。今回は各アプリケーション毎に 60 秒ごとにチェックを行って欲しいので以下のように init_config に定義した。
init_config:
  min_collection_interval: 60

instances:
  - name: Python-App
    host: 127.0.0.1
    port: 18181

  - name: Ruby-App
    host: 127.0.0.1
    port: 18282
尚、各 instance 毎にインターバルの設定を変更したい場合には以下のように記載しても動作することを確認している。また、デフォルトの 15 秒以下を指定しても指定した時間 + 15 秒間隔となってしまうのであまり意味が無いと考える。更に、init_config で定義した値は instances で個々に定義した値で上書き可能である。
init_config:

instances:
  - name: Python-App
    host: 127.0.0.1
    port: 18181
    min_collection_interval: 180

  - name: Ruby-App
    host: 127.0.0.1
    port: 18282
    min_collection_interval: 300
Datadog Agent を再起動する。
$ sudo service datadog-agent restart
アプリケーションのログを確認する
暫くするとアプリケーションのログが記録される。
$ tail -n 2 *-log.txt ==> python-log.txt ruby-log.txtほぼ 60 秒 + 15 秒程度でアプリケーションへのアクセスが発生していることが判る。(厳密に 60 秒では無いのは謎...→も少ししらべやう)
Network Monitor を定義する
Monitor の定義には barkdog を使うと捗る。
以下のように API キーと APP キーを定義するところから始める。
$ export BARKDOG_API_KEY='xxxxxxxxxxxxxxxxxxxxxxxxxxxxxxxxxxxxxxxxxxx' $ export BARKDOG_APP_KEY='xxxxxxxxxxxxxxxxxxxxxxxxxxxxxxxxxxxxxxxxxxx' # Monitor の定義を export する $ barkdog --export --outfile Barkfile以下のように定義。
$ cat Barkfile (snip) monitor "Python-App", :type=>"service check" do query ""tcp.can_connect".over("host:vagrant-ubuntu-trusty-64","instance:python_app").by("host","instance","port","target_host").last(6).count_by_status()" message "@slack-datadog-notification" options do no_data_timeframe 2 notify_audit false notify_no_data false renotify_interval 0 silenced({}) thresholds "critical"=>5, "ok"=>3 timeout_h 0 end end monitor "Ruby-App", :type=>"service check" do query ""tcp.can_connect".over("host:vagrant-ubuntu-trusty-64","instance:ruby_app").by("host","instance","port","target_host").last(6).count_by_status()" message "@slack-datadog-notification" options do no_data_timeframe 2 notify_audit false notify_no_data false renotify_interval 0 silenced({}) thresholds "critical"=>5, "ok"=>3 timeout_h 0 end end (snip)Datadog の内部的には
tcp.can_connectという監視項目になるようだ。ちなみに、HTTP Check の場合にはhttp.can_connectとなる。以下のように適用。
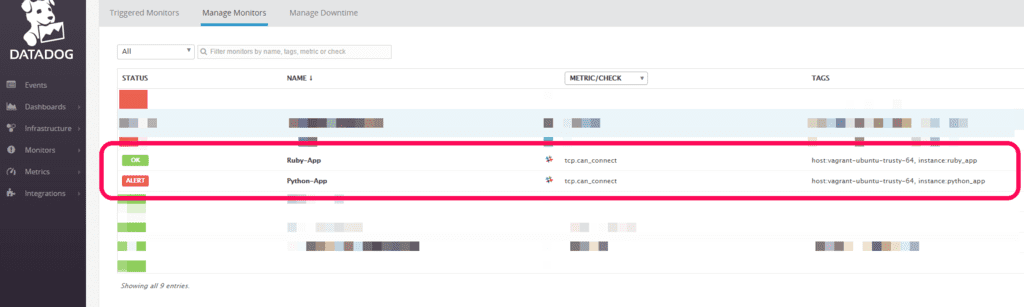
$ barkdog --apply --dry-run $ barkdog --apply以下のように Manage Monitors にリストアップされる。
以上
厳密に指定した時間でインターバルされないのはちょっと謎だがデフォルトの 15 秒間隔だとちょっと短いかなと思ったら
min_collection_intervalの設定を検討したい。以上。
元記事はこちら